314-grp-301
Meet Team 301
 |
 |
| Brian Wegner [Electrical Systems & Organizational Leadership] | Fynn Meyerhoff [Robotics Systems] |
 |
 |
| Xzekiel Trevino [Electrical Systems] | Kevis Seymore [Electrical Systems] |
Introduction
This report is a comprehensive compilation of Team 301’s efforts in developing the Portable Weather Station for the EGR-314 course during the Spring 2024 semester. It provides an integrated analysis of all relevant assignments, distilled into this unified document to facilitate easy access and reference. For in-depth exploration of specific topics, readers can navigate through the document by clicking on the hyperlinked headings corresponding to each chapter. Additionally, a curated selection of previous multimedia exhibits related to this project has been incorporated below to enhance understanding and engagement.
Team Organization
Introduction
Teams serve as the backbone of engineering projects by facilitating collaborative efforts and pooling individual contributions to tackle tasks that would normally overwhelm a single individual. By leveraging expertise and experiences, team members can collectively navigate complex problems. Each member adds a unique perspective and various skill sets that add value to their team and project. Through this synergy, teams provide a foundation of support to other team members by offering mentorship, shared learning, and fostering personal relationships that often improve the overall performance of the team.
Mission Statement
“Our mission is to improve weather reporting by designing and implementing solutions that provide localized, real-time weather data in a wide range of environments and conditions. With a user focused experience in mind, our goal is to provide end users with the tools needed to make the necessary and informed decisions required in their daily activity planning.”
Goal Development Methodology
Goal setting is an important step towards achieving project success by offering teams a path and a sense of purpose. Through the establishment of specific criteria (e.g. SMART method), teams can organize their objectives into a structured framework, enhancing clarity and bolstering the likelihood of accomplishment. The SMART method sets forth standards for goal creation by breaking objectives down into more distinct components: Specific, Measurable, Achievable, Relevant, and Time-bound criteria. This approach ensures that goals are clearly defined, quantifiable, realistic given available resources, aligned with project objectives, and bound by a defined timeline. By adhering to SMART methodology, teams can create goals that are actionable and increases the likelihood of the project succeeding.
SMART Method
Specific: Goals should be clear, precise, and well-defined.
Measurable: Goals should be quantifiable, allowing progress to be tracked objectively.
Achievable: Goals should be realistic and attainable given available resources and constraints.
Relevant: Goals should be aligned with the overall objectives of the project.
Time-bound: Goals should have a specific deadline or timeframe for completion.
Project Goals
• Specific: Our goal is to design and fabricate a device specifically tailored to measure temperature and humidity accurately for end-users.
• Measurable: We will measure the success of our device by its ability to provide temperature and humidity readings with a precision of at least ±0.5°C for temperature and ±2% for humidity.
• Achievable: Leveraging the skill sets acquired from previous assignments in the EGR-3X4 courses, designing and fabricating such a device is well within our capabilities for this project.
• Relevant: This goal aligns with our project’s overall objective of developing innovative solutions to meet end-users’ needs for accurate environmental monitoring.
• Time-bound: We aim to complete the design and fabrication of the device within Spring 2024 semester.
7 Shared Goals
- Improve in Designing for Widespread Use:
- Focus on creating designs that are universally accessible and usable.
- Cater to Needs of the User:
- Prioritize user experience and user-centric design in our solutions.
- Build Network:
- Expand our professional and collaborative network for better outreach and resources.
- Practice Using a New Microcontroller:
- Enhance technical skills by experimenting with various microcontrollers.
- Continue Practice in PCB Creation:
- Develop expertise in printed circuit board design and manufacturing.
- Optimize Designs for Scalability and Adaptability:
- Create solutions that can be easily scaled and adapted to different environments and needs.
- Continuous Improvement in Design Processes:
- Commit to an iterative process of design improvement and refinement.
- Commit to an iterative process of design improvement and refinement.
User Needs, Benchmarking, and Requirements
Introduction
Understanding the needs and requirements of the end user is an important step in the design and product development process. By determining the end-user needs early in the development process, engineers can tailor the system’s features, functionality, and performance needs to address the user’s preferences. Benchmarking allows engineers to compare their product’s performance against already existing solitons and industry standards by providing side-by-side comparison. This can lead to designers improving on already existing products by innovating and improving on product concepts already in the market.
Similar Products
To gather a a basis to work from and a benchmark to evaluate our design to, we found a number of similar products described below.
Search #1 - Sainlogic Wireless Weather Station
Keywords: “Weather Reader”
Selected Products
Sainlogic Wireless Weather Station
link - Used to read various specific weather statistics
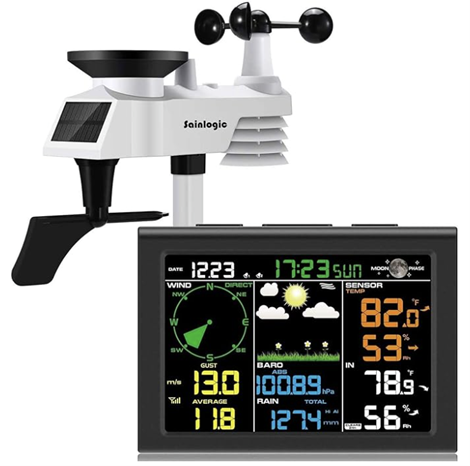
Price: $103
Vendor: Amazon
Common Positives Consist Of:
|Customer Review|Customer Need|
|-|-|
|“Had it up and running in less than an hour. Only disappointment was that no batteries were included. Other than that, I’m absolutely satisfied. Easy to read and accurate.”|Very easy to use and accessible (Explicit)|
|“Weather station was installed in my elderly parents’ study to give them weather details to help them plan their outdoor activities. It was easy to install and worked well even though their home is a metal building. Works as expected and readings are accurate.”|Easy installation and accurate (Explicit)|
|“The base unit readout screen is nice, good contrast, lots of information on it, more than we had on the last one. It hasn’t rained yet, so we haven’t seen how that works yet, but the rest of it has been effective, in comparison to our neighbors and some other readouts we have available nearby. Setting all the options along with date, time, and measurement/unit preferences was quick and easy.”|Offline usage (Latent)|
Common Negatives Consist Of: |Customer Review|Customer Need| |-|-| |“We have owned this weather station now for a year and half. Don’t buy it. It’s a piece of garbage. Wind direction is totally wrong even though I aligned it with the true north. I have twisted it this way or that to try to get it to read the direction correctly, but it has never worked accurately no matter what I do. The rain volume sensor is a joke as it has never been accurate either. There is no wind chill calculation showing on the monitor, which is a handy thing to know when you live in a cold climate as we do. We have owned much more accurate and useful weather stations in the past than this brand. I bought a different brand weather station over Black Friday and plan on mounting it this spring when the weather gets nice again.”|Wind Chill Calculation (Explicit)| |“Downgrading to 1 star. Every time I change the batteries(3 months), I’m reminded what a POS this thing is. Now it wont reconnect. It’s not mounted in an easy to troubleshoot location. (It’s in a good weather recording location). Next stop… TRASH CAN!!”|Troubleshooting Convenience (Latent)| |“This weather station worked for a couple of months, then stopped transmitting the outside temperature, wind speed and rainfall. We changed the batteries, went out and bought expensive lithium batteries and the reset button on the unit stayed red, never green like it’s supposed to be!”|Consistent Transmission (Latent)|
Search #2 - Wi-Fi Professional Weather Station
link - Weather station to detect weather stats
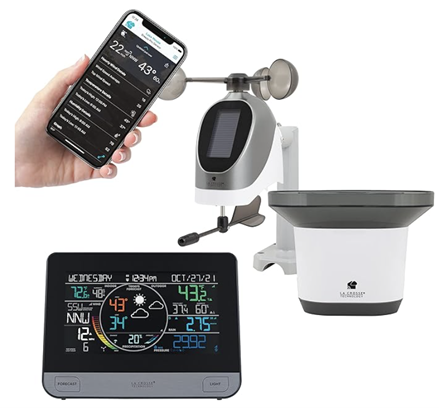
Price: $140
Vendor: Amazon
Common Positives Consist Of: |Customer Review|Customer Need| |-|-| |“I love that you can add censors. We have one in our chicken pen, green house, garden and down by the river. Super easy to use and connect .”|Compatible with other sensors (Latent)| |“I am beyond impressed with my Wi-Fi Professional Weather Station! This device has truly elevated my understanding of weather patterns and brought forecasting to a whole new level. The seamless integration with Wi-Fi allows me to access real-time data effortlessly through my smartphone, keeping me informed about current conditions and forecasts from anywhere.”|Wifi compatibility (Latent)| |“The user-friendly interface and detailed graphs make it easy to interpret complex weather patterns, making this weather station suitable for both weather enthusiasts and professionals alike. I particularly appreciate the customizable alerts that notify me of any sudden changes, allowing me to take timely actions.”|Customizable Alerts (Explicit)|
Common Negatives Consist Of: |Customer Review|Customer Need| |-|-| |“Bought one same/similar to this from Costco at a much better price. Loved everything about it except the rain gauge. It kept blowing over during storms, so I would be running out during storms to stand it back up only to have it blow over again. I returned it. If you want one that tracks rain, buy a one piece unit with an integrated rain gauge.”|Stability in during Storms (Explicit)| |“rain gauge does not collect as much rain as a small tube. Tech support says they are perfect reading almost an inch different on three inches of rain and not reading on a quarter of an inch.”|Accurate Rain Collection in Rain Gauge (Latent)| |“Firstly, the Wi-Fi connectivity is inconsistent at best. Despite multiple attempts to set up the connection, the device frequently loses connection, making it unreliable for remote access. This significantly diminishes the convenience factor that comes with a Wi-Fi-enabled weather station.”|Importance of Reliable Wi-Fi for Convenience (Explicit)|
Search #3 - Ambient Weather WS-2902 WiFi Smart Weather Station
link - Smart Water Monitor
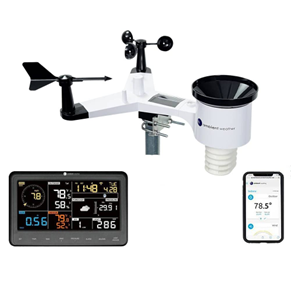
Price: $189.99
Vendor: Amazon
Common Positives Consist Of: |Customer Review|Customer Need| |-|-| |“If you are looking for a great weather station at great price this is the perfect unit. This station has all the basics you would want and more. Rain gage that measures not only the amount of rain but hourly rain fall as well as 24 hour rain fall, weekly, monthly and rain event totals. The unit has a wind vain and anemometer for wind direction and speed, of course. It also has temperature with heat index and wind chill. We have a pool so I love that the unit measures UV index and Solar Radiation.”|Accurate Forecasting (Explicit), Mobile Accessibility (Explicit), Visual Representation (Explicit)| |“Durability. This is the one area I cannot yet commend the AW on, only time will tell. It appears to be a better-built unit so I am optimistic and will update this review as necessary.”|Ruggedized/All-Weather (Explicit)| |“ I also created an account at the Ambient website so I can see remotely on both the Ambient web site via a web browser and via the Ambient iPhone app – I use an iPhone and it works great.”|Mobile Accessibility (Explicit)|
Common Negatives Consist Of: |Customer Review|Customer Need| |-|-| |“So I take the display apart. Inside clearly labelled on the PCB is the antenna connection, and attached is a loose, 9.5 cm long red wire hanging out in the case (see photo). The antenna is just a small length of red wire. Now I’m not an RF engineer, but 9.5 cm isn’t even a length that makes sense for picking up a 915MHz signal, and even worse its bent around a corner of the case so the shape of the wire is even less optimized. Don’t get me wrong, you can use a wire like this to pick up a wireless signal it just works really bad and explains the problems people have with reception completely.To verify this I soldered on a proper sma connector and hacked it into the case (see my photo). Even with an antennae tuned to a completely different spectrum (2.4GHz/wifi) I was getting clear reception from the other side of my house 100% of the time.”|Effective Antenna Design (Latent)| |My main complaints are; the only things that are accurate from day one until now are the indoor and outdoor weather and the indoor humidity. I was really looking forward to seeing the wind speed and the rainfall amount. The wind speed has never shown over around 13 mph even when I know we were gettting 40 mph gusts. It is windy enough as I write this that my flag is standing straight out and my station says 4.1-4.6 mph.|Ruggedized/All-Weather (Explicit)| |“I bought this to replace my long-serving WS-1001 when it died. The sensors are nice and easy to install. I am not a fan of this new display even though it is color compared to my old one which was B&W. The viewing angle is pretty poor. Although it has mounting holes to enable it to hang on the wall it is very tough to read if hung at picture height. The display really needs to be below eye level. The old display did not have this limitation. And although this is a color display the colors don’t mean anything - they’re static and pretty random. I know how to grab the data from the sensors directly so I think I’ll build my own display.”|Visual Representation (Explicit)|
Search #4 - Newentor Weather Station
Newentor Weather Station Wireless Indoor Outdoor with Rain Gauge and Wind Speed, Professional Tempest Digital Weather Stations with Data Logging and Alerts, Weather Forecast, Barometer, Solar Powered
link - Weather station to detect weather stats
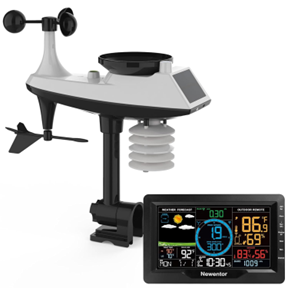
Price: $129.99
Vendor: Amazon
Common Positives Consist Of: |Customer Review|Customer Need| |-|-| |“This weather station was easy to set up using the nice full book size color instructions. It has good information about current weather conditions”|Multi-Location Support (Explicit)| |“This weather station was easy to set up using the nice full book size color instructions. It has good information about current weather conditions”|Learning & Tips Resources (Latent)| |“The unit works perfectly! I love the colorful screen and the other features that it has. I will be purchasing another.”|Visual Representation (Explicit)|
Common Negatives Consist Of: |Customer Review|Customer Need| |-|-| |“Sensor died within 6 months, zero tech support”|Ruggedized/All-Weather (Explicit)| |“Temperature sensor outdoor measures 12 degrees to hot when the sun shines on the sensor. Emailed the manufacture they said this is normal. If you want accurate outdoor temperature you will want a different weather station.”|Accurate Forecasting (Explicit)| |The weather forecast is not connected to a weather service but rather overall change in barometric pressure. Which could actually be interesting information as I can get the local forecast other places.|Integration With Other Apps/Platforms (Latent)|
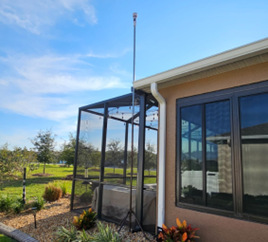
Search #5 - Tempest Weather System
link - A Complete Weather Solution for Your Home
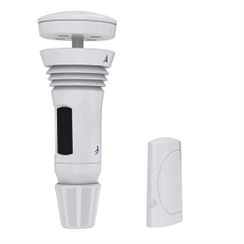
Price: $340
Vendor: Amazon/Shop WeatherFlow
Common Positives Consist Of: |Customer Review|Customer Need| |-|-| |“This truly is the only ‘rain sensor’ that has ever really worked consistently with my smart irrigation controller, and I get all the other great weather station features as well.“|Consistent Rain Sensor for Smart Irrigation (Explicit)| |“Temperatures have been spot on, wind readings are responsive and accurate. The lighting detection is unbelievable – you can track storms heading in and leaving with just this feature alone. Highly recommend the new Tempest.”|Effective Storm Tracking with Lightning Detection (Explicit)| |“I recently switched from my old Davis Vantage Pro to the Tempest, and overall, I’m pleased with the decision. The build is solid, and the readings are accurate, but I miss the convenience of a remote console in the kitchen for a quick and easy summary of the station’s data, a feature lacking in the Tempest. Despite this, I don’t mind the rain adjustments based on local stations’ data, which some users complain about, as it can be turned off if desired.”|Desire for Convenient Remote Console (Latent)|
Common Negatives Consist Of: |Customer Review|Customer Need| |-|-| |“Everything worked seamlessly for several days until I got a message on Saturday about a data update issue. Spent four frustrating hours troubleshooting online, checking and rechecking everything. Turns out, the problem was a “Pressure Failed” sensor, and despite multiple attempts to fix it, I ended up packing the $350+ unit for return by Monday, disappointed that it failed so quickly.”|Reliable Performance (Explicit)| |“Living in a consistently rainy area with varying precipitation amounts, I’ve been disappointed with the Tempest’s accuracy in representing rainfall over the 18 months it’s been installed, finding it to be greatly underrepresented and expressing regret over the decision to use the tool.”|Accurate Rainfall Representation (Explicit)| |”Despite the initial hype, this weather station proves ineffective in northern climates, requiring excessive winter sunlight, providing inaccurate measurements, and lacking satisfactory customer support, leading the user to suggest investing in more established brands.”|Climate-Adaptive Functionality (Explicit)|
Search #6 - OTT HydroMet Urban Flood Warning System
Link - Weather station to detect weather stats
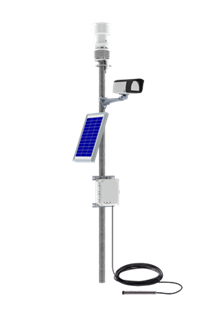 Price: Unlisted - Priced at Order
Vendor: OTT Hydromet
The OTT HydroMet Urban Flood Warning System has been included as an extra search option despite it not having product and/or review data that aligns with this assignment. It has been included, despite the missing data, as a direct to consumer made item by the company. The device is designed for government services, not for regular private use. Because of this, there are a lack of private user reviews as the product was not designed to be sold to them.
The system has been included since it is a close representation of the intended finished product aimed at non-commercial use. This aligns with the conceptual idea of an early warning flood detection system to detect and warn civilian populations of localized flooding conditions for emergency management.
Additional User Needs
Understanding both explicit and latent user needs is an important step in engineering project management that ensures the development and success of user-focused designs. Explicit needs are those articulated by the user, while latent needs are implied needs. In the following lists, our team outline both explicit needs and latent user needs that helped shape and develop our team’s final project.
Explicit
- Real-Time Data Access
- User-Friendly Interface
- Accurate Forecasting
Ambient Air Temperature
Water Temperature
Wind Speed
Water Flow Rate
Water Depth/Rain Detection
Humidity Detection - Customization Options
Unit Conversions temperatures (e.g. Fahrenheit vs Celsius)
Unit Conversions (e.g. Imperia Standard vs Metric) - Multi-Location Support
- Mobile Accessibility
- Visual Representation
- Severe Weather Alerts
- Historical Data Access
- Integration With Other Apps/Platforms
- Language and Units Customization
- Energy Efficiency Insights
- Air Quality Information
- Ruggedized/All-Weather
Water proof
Submeragable (water submerged system component)
Latent
- Contextual Insights
- Social Integration
- Localized Community Updates
- Personalized Lifestyle Recommendations
- Travel Planning Assistance
- Emotional Impact Consideration
- Learning Resources
- Offline Accessibility
- Eco-Friendly Recommendations
- Integration with Smart Home Devices
- Mood Customization
- Collaborative Forecasting
User Needs Jamboard Summation
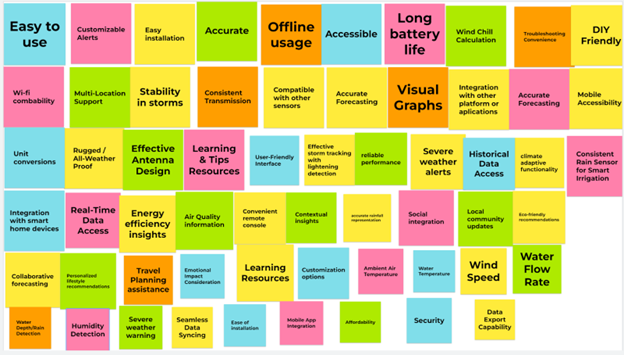
User Needs Organization / Ranking
Develop Requirements
User Story Statement
User Story #1: Kevin (Home owner, private resident)
Kevin is a homeowner who resides in an area prone to flash flooding. Realizing the potential damage of flooding to his property, Kevin is interested in purchasing an all-weather station in order to mitigate flood risks to his personal property. With an early detection system, Kevin is able to safeguard his property by either relocating it or preparing counter-flood mitigation techniques (e.g. sandbags).
User Story #2: Jane (County Emergency Services Management)
Jane is an emergency service management specialist employed by the county and is responsible for monitoring extreme weather conditions that affect the public. To best serve the public, Jane relies on an early warning weather network of ruggedized remote weather stations that can detect real-time weather conditions and changes within the county. With this information, precise real-time weather updates can be sent to emergency management teams to aid them in warnings, emergency responses, and other critical decision-making processes.
Design Aspects
Listed are the original, design aspects prior to the change to a more minimalistic, portable weather system. After the the given aspect, it is noted whether it was met :white_check_mark: by the final device or if it was not :x: and why.
- Product Design
1.1 The product’s exterior should be minimalistic to be unobtrusive visually in a water environment such as a controlled stream. :white_check_mark:
1.2 The shape of the device should not have sharp and jutting portions that would cause debris in a waterway to build up on it. :white_check_mark: [Though, not intended for use in a waterway.]
1.3 The tether pole shall have a groove that keeps the device facing properly up or downstream as intended. :x: [No longer intended for use in a wateray.]
1.4 The product shall be designed to be watertight. :x: [No longer intended for use in a wateray.]
1.5 The product’s exterior should have mounting capabilities so that it stays secure in a storm. :x: [Device was made to prioritize portability, but fasteners could be added to a later iteration.] - Functionality
2.1 The device must be able to determine its relative height and compare it to a baseline while noting significant changes over short periods automatically. :x: [No longer intended for use in a wateray.]
2.2 The device shall be able to determine the water flow rate. :x: [No longer intended for use in a wateray.]
2.3 The device shall be able to determine wind speed (where placed). :x: [Device determines temperature and humidity instead.] - Interactivity
3.1 The device shall have a simple push button to enable and disable. :white_check_mark: - Adaptive Intelligence
4.1 The device shall be able to provide itself with additional lift as needed if something has caused it to become too submerged. :x: [No longer intended for use in a wateray.] - Customization
5.1 The device can have multiple colors for the exterior to be able to make it blend in with a waterway or stand out to be easier to find and collect. :white_check_mark: [Though, not intended for use in a waterway, it would be asy to manufacture and replace the device chassis.] - Manufacturing
6.1 The total cost of the prototype shall be < $240. :white_check_mark:
6.2 The device shall be designed with a minimal amount of parts. :white_check_mark: - Regulations
7.1 The device shall not chemically alter the water in which it is placed. :white_check_mark: [Not chemically harmful, though, not intended for use in a waterway.]
Open Questions
- Can the device be made easily recyclable and repairable? :white_check_mark: [The device can be easily repaired if the user/tech is knowledgable, but it is not intended for recyclables.]
- Can we connect the device to a power source safely to remove the need for batteries? :white_check_mark:
- Is there additional functionality that can be added with later modifications or simply with code? :white_check_mark: [Additional data tracking can be added easily prior to distribution.]
Design Ideation
Introduction
Design ideation is a crucial stage in the creative process, where diverse ideas are generated through brainstorming sessions. The objective is to produce a wide array of innovative concepts that may serve as springboards for further exploration. While individual ideas hold value, the true innovation process unfolds when these ideas are collected, compared, and juxtaposed, allowing designers to weave together concepts that may have gone unnoticed in isolation. Once a multitude of concepts is amassed, the next step involves sorting, ranking, and grouping ideas to uncover synergies and connections between them, enabling designers to visualize how various concepts can complement and integrate with one another.
The analysis of requirements and potential functionality lead us to concept the designs shown below each with their own advantages and disadvantages.
1. Brainstorm Table of Features/Ideas/Concepts
| 5 in 1 Outdoor Sensor | Weather Clock | Clear Color Display | Precise Measurements | Radio/Transmission |
| Accuracy | Mobile | Wind Speed Gauge | Air Pressure | Moon Phase |
| Alarm Clock | 3rd Party Compatible | Bright Display | Rain Gauge | Temperature |
| Solar Powered | UV Protectant Plastic | Wind Propeller | Noise Detector | Offline & Online Usage |
| Backup Battery | Smart Irrigation Compatibility | Low Latency Transmission | User Customization (DIY Friendly) | Custom Alerts, Badges |
| Rugged Design for Storms | Rain Collection Gauge | High UV Detection | Thermo-Hygrometer | Bubble Level |
| Air Quality Sensors | Multi-mounting Ability | Fully Submersible | Nature Friendly | Built-in Speaker |
| Historical Trend Graphing | Built-in Light (for Errors) | Long Range Transmission | Dew Point Sensor | Barometric Pressure |
| Sea-level | Lightning Detection | Rain Rate Detector | Snow Depth Sensor | Geolocation |
| Crop Weather Reminder | Sunrise and Sunset Detection | Customizable Device Skins | Earthquake Alerts | Wildlife Motion Tracking |
| Security System | No Maintenance | Cylindrical Shape for Portability | Separate Display | Satellite Compatibility |
| Weather Almanac Data | GPS Capability | Intranet Network | Cold-Weather Proof | Localized Display |
| Localized Configuration | Remote Configuration | All-Weather Ruggedization | Hot-Weather Proof | Anti-theft Protection |
| Tamper Protection | Fault Detection & Reporting | Battery Backup 24h Service | Wind Direction Gauge | Water Temperature Gauge |
| Water Flow Rate Tracking | Water Rise/Depth Detection | Warning System | 4G/5G Cell Network Integration | Radio Communication Network |
| Soil Absorption Detection System | Soil Erosion Detection | Auditory Warning System | Emergency Rescue Button to EMS |
2. Sort, Rank, and Group Design Concepts
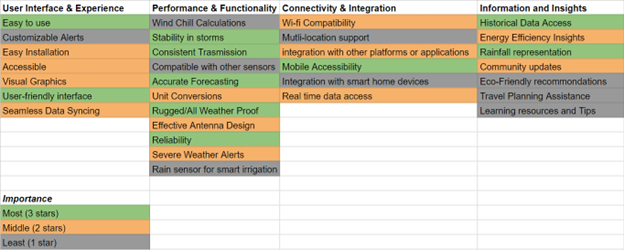
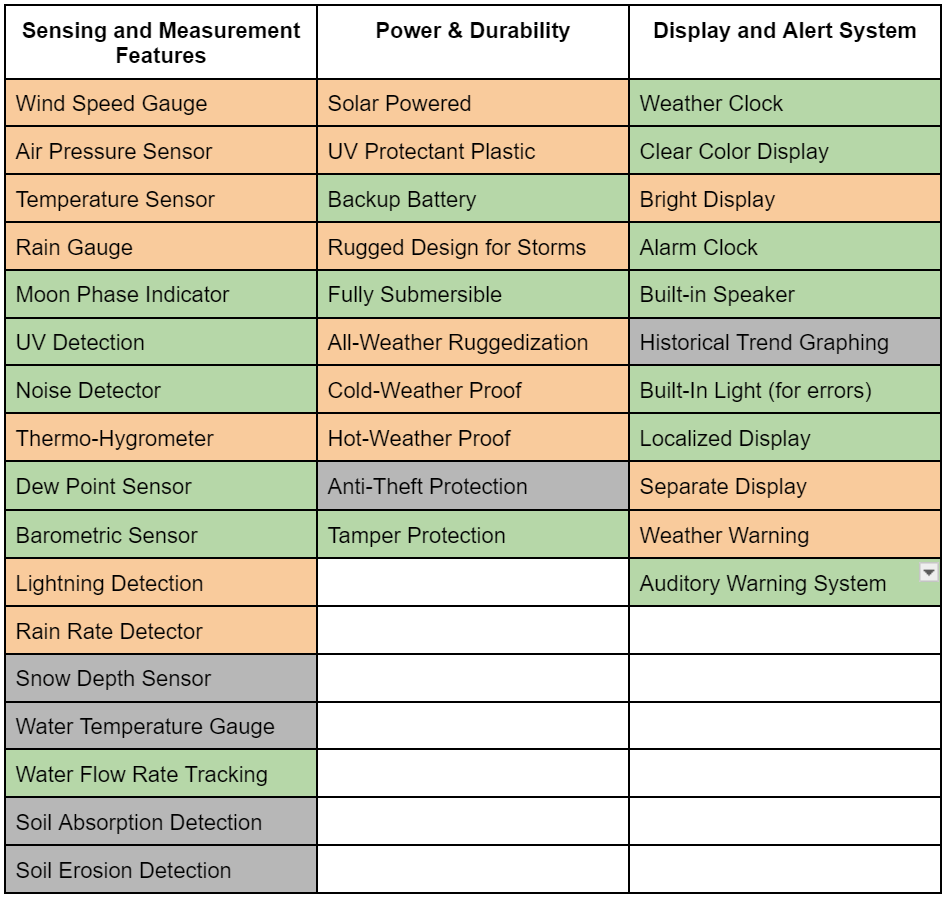
Here are two tables organizing our brainstorming ideas/concepts/features into six different categories. They are ranked by interest level, indicated by the following colors:
- 🟠 Orange for highest interest
- 🟢 Green for neutral interest
- ⚪ Gray for lowest interest

3. Our three product concept sketches
In this step of the design process, we conducted research on existing products available to the public that could serve as models for our project, to be tested against and improved upon. Our investigation identified three similar yet distinct products meeting the criteria of a weather device for our project. The first is a portable weather device providing localized weather conditions at the user’s location. The second is a solar-powered weather detection system aimed at providing weather data to emergency management services (EMS). The third project is a Flood Detection Buoy designed to detect flash flooding in areas prone to rapid and rising water levels during storms.
All three concepts satisfied the requirements of a weather-related device, but each possessed unique characteristics. After careful deliberation and comparison of the three potential projects against our SMART Goals and user needs, it was determined that concept 1, the Weather Pod, would be the ideal project.
Cocept 1 (Portable Weather Pod)
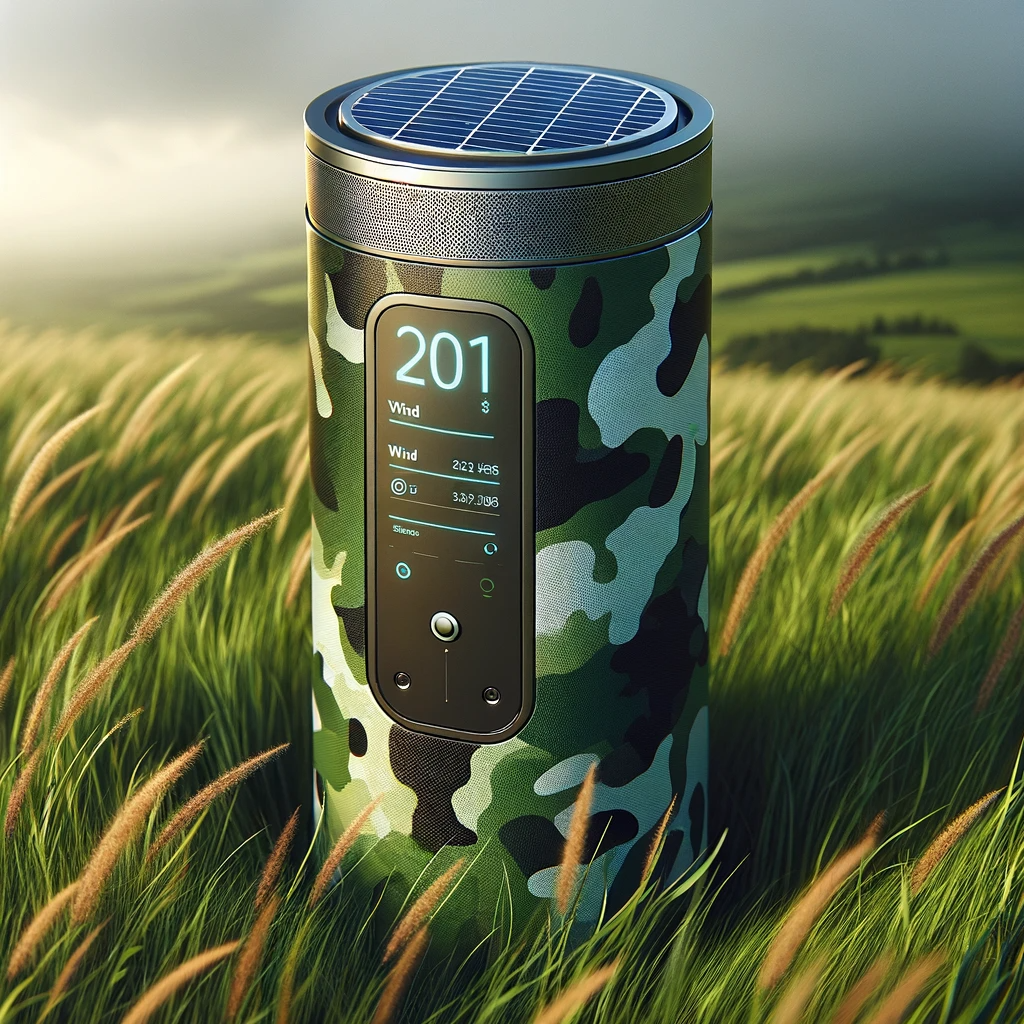
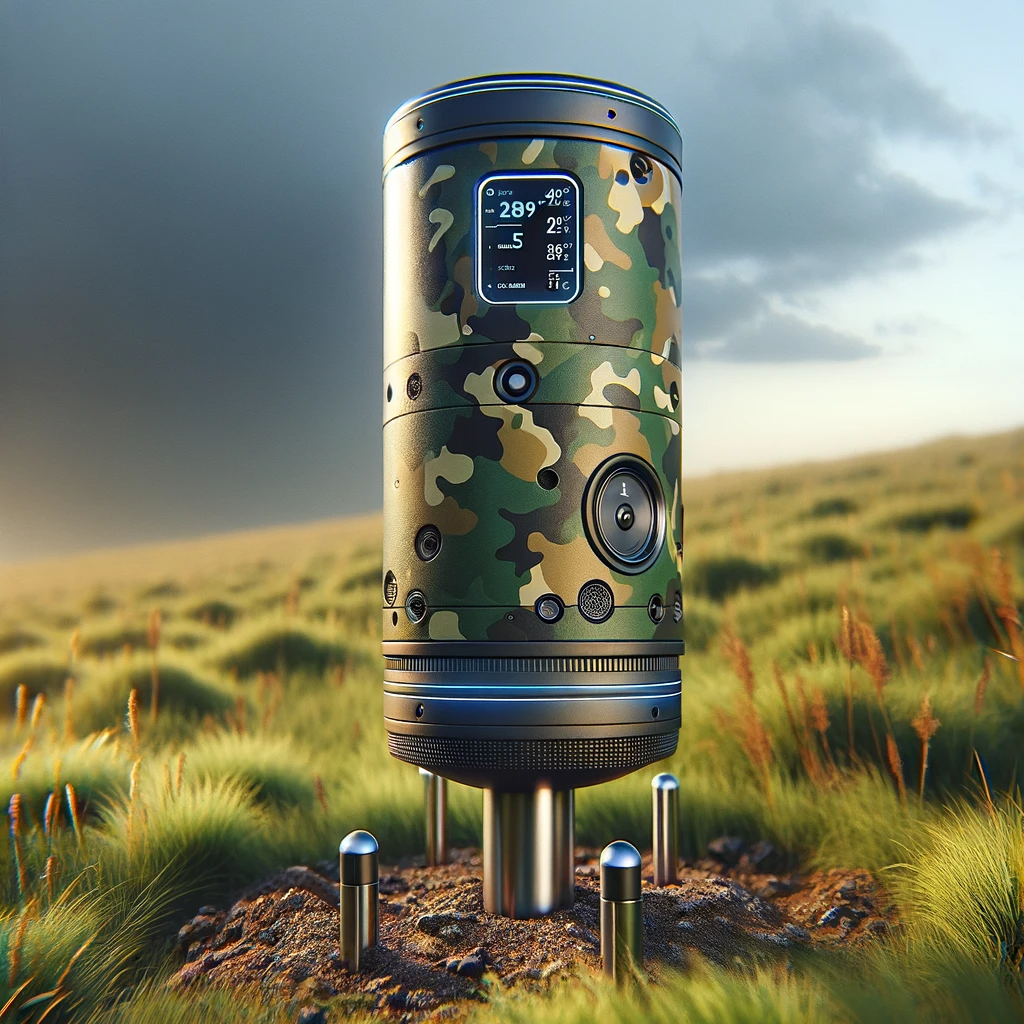
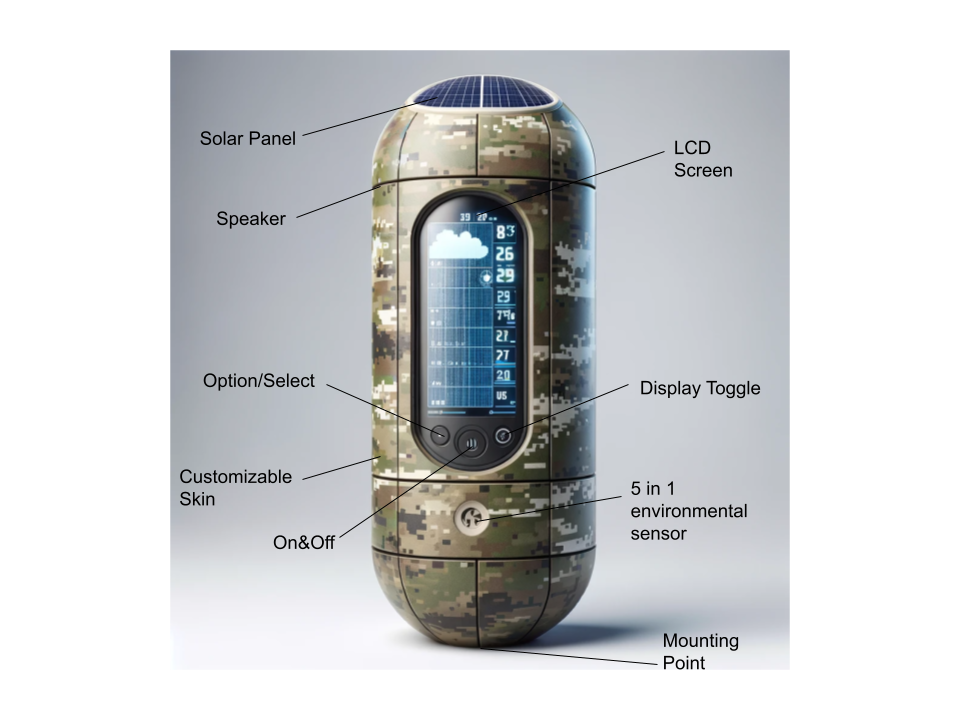
Description
This portable weather pod features a simple and compact design, equipped with several advanced features. It includes an onboard OLED screen displaying data from various environmental sensors. The pod’s customizable skin (camouflage shown) allows the user to blend it seamlessly into the appropriate environment.
:zap: Key Features
- Solar Powered: Utilizes solar energy for efficient power use.
- Portable: Easy to move and install in various locations.
- OLED Display: Clear and informative data presentation.
- Speaker: Audio feedback for alerts and notifications.
- Full Weatherproof: Designed to withstand harsh environmental conditions.
- 5-in-One Sensor: Multi-functional sensor for comprehensive environmental data.
- Temperature: Measures ambient temperature accurately.
- Humidity: Monitors air moisture levels.
- Barometric: Provides pressure readings.
- Wind: Measures wind speed and direction.
- Rain: Detects precipitation and rain intensity.
Concept 2: Portable Adverse Weather Detection System
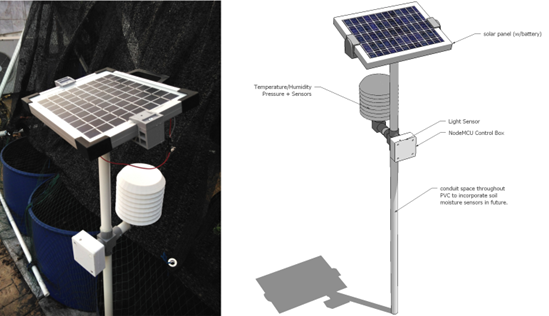
Description
The Portable Adverse Weather Detection System serves as an early warning and monitoring system for adverse weather conditions and flash flooding. Incorporated with other detection systems, it provides emergency management services (EMS) with the capability to detect and monitor areas at risk of flash flooding. This service offers EMS real-time data of ground conditions, aiding in delivering more accurate weather warnings to the public and responding to emergencies as required.
:zap: Features
- Solar Power with Battery Backup: Ensures continuous operation, independent of external power sources.
- Adjustable Solar Panel (Motorized): Solar panel adjusts automatically according to the time of day for optimal energy capture.
- Precipitation Detection and Monitoring (Sensor 1): Accurately detects and monitors rainfall and other forms of precipitation.
- Ambient Air Temperature (Sensor 2): Measures and records the ambient air temperature.
- Remote Access (WiFi): Allows for remote monitoring and control via WiFi connectivity.
Concept 3: Waterway Weather and Flash Flood Detection Buoy
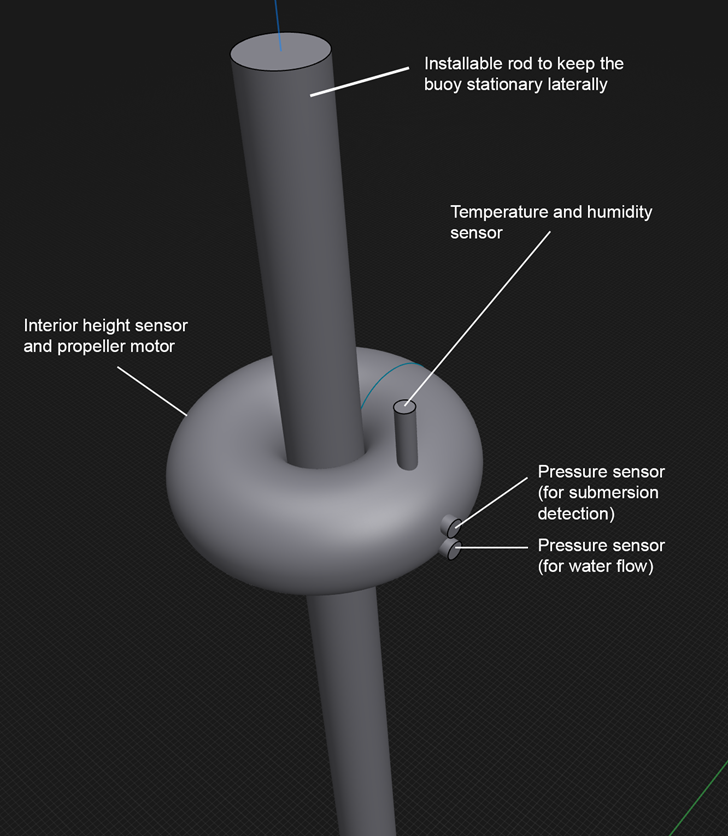
Description
The Waterway Weather and Flash Flood Detection Buoy would serve a similar purpose as Concept 2, but be housed in a waterway. It wirelessly communicates temperature, humidity, water flow rate, and change in water level over time. Not only providing present values, it is also programmed to send out alerts for various conditions like sudden rises or falls in water flow rate and water level. This enables it to issue flash flood warnings or other preset alarms based on a target baseline. The device is waterproof and capable of detecting when it’s submerged, with basic mechanisms to surface itself.
:zap: Features
- Sensors:
- Temperature: Measures ambient temperature.
- Humidity: Monitors air moisture levels around the waterway.
- Pressure (Directed Towards Expected Water Flow): Used to determine water flow-rate.
- Movement: Tracks height and changes in water level.
- Motor-Controlled Height Adjustment: Attached to an installed rod, allows the buoy to adjust its height relative to water level.
Selected Design
After deliberating among the three concepts and aligning them with our SMART goals and end-user needs, while ensuring they fell within our levels of expertise, we concluded that pursuing the Portable Weather Pod as our final design project was the best course of action. This decision was primarily influenced by the limitations of the other two projects, but more significantly by the Weather Pod’s potential as a practical end-user product.
Designs two and three were disregarded due to the challenges associated with designing a watertight system, logistical complexities of testing under adverse weather conditions, and the requirement for additional systems beyond the course scope, such as GPS for movement tracking. Additionally, the introduction of a motor system to designs two and three seemed cumbersome and a feature not aligned with the projects purpose.
Final Concept: Portable Weather Pod
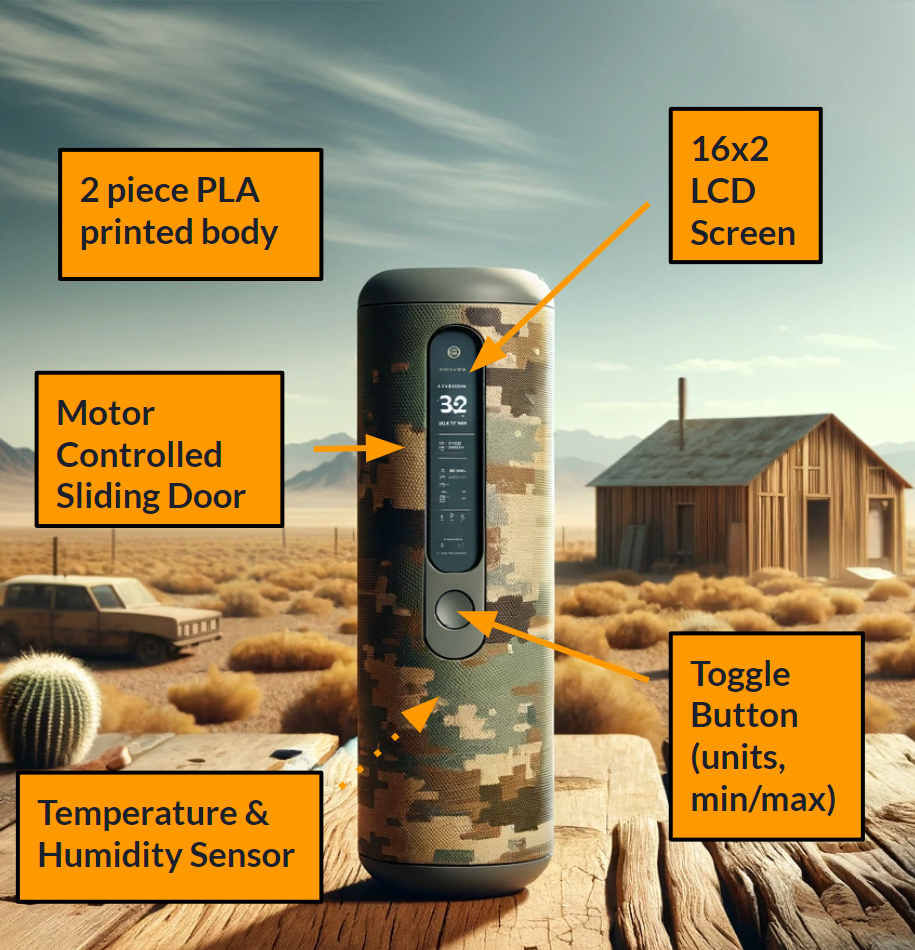
:zap: Key Features
- Portable: Easy to move and install in various locations.
- Weatherproof: Designed to withstand harsh environmental conditions.
- OLED Display: Clear and informative data presentation.
- WIFI Capable: Uses the ESP32 chipset to transmit data to the net.
- 2 Key Sensors: Multi-functional sensor for comprehensive environmental data.
- Temperature: Measures ambient temperature accurately.
- Humidity: Monitors air moisture levels.
Block Diagram
A block diagram is a visual representation of the components and connections within a system or device. It is illustrated through simplified blocks and lines allowing for quick interpretation of how different subsystems rely upon one another. In the context of our Weather Pod project, the block diagram provides a comprehensive overview of the key subsystems and their interconnections.
The diagram illustrates all the key subsystems of the Weather Pod device. The setup was determined by the selected sensor components and their communication protocols. We needed the temperature sensor, humidity sensor, and motor driver to communicate with the microcontroller’s limited availability of I2C and SPI pins. Initially, this posed a challenge as the MCU could only support two I2C devices and an SPI device, necessitating multiple devices to share a pin. However, this issue was resolved through software and coding solutions by implementing recognition and communication with different addresses for the devices.

Final Component Selection
1 - Motor Driver
- System Lead: Kevis Seymore
- Choice: IFX9201SGAUMA1
- Rationale: The IFX9201SGAUMA1 motor controller has been recommended for similar use cases and has a thorough datasheet and support around it helping eliminate much of the guesswork when attaching it to a PCB or coding for it.
Driver Solution: IFX9201SGAUMA1

Cost: $4.00 per unit
| Pros | Cons |
|---|---|
| Low standby current | Complex chip |
| Overtemp shutdown | Limited to DC motors |
| 3.3V logic compatible |
2 - Motor
- System Lead: Kevis Seymore
- Choice: LS-00028
- Rationale: The LS-00028 motor offers the perfect balance of compact size and high efficiency, making it an excellent choice for our small scale project.
Motor Solution: LS-00028

Cost: $5.98 per unit
| Pros | Cons |
|---|---|
| Cost Effective | Small Torque |
| Efficient | Limited Speed Control |
3 - Temperature Sensor
- System Lead: Xzekiel Trevino
- Choice: TC74A4
- Rationale: The TC74A4 temperature sensor is the ideal for our project based on price point, supporting documentation and fits within the expected voltage operating range of the project. While the sensor degrades in accuracy after 100° F, the drop off is negligible within ranges it will be operating within.
Temp Sensor Solution: TC74A4

Cost: $1.15 per unit
| Pros | Cons |
|---|---|
| High Precision | Limited Temperature Range |
| Low Power Consumption | No Analog Output |
| Easy Integration | Single Address |
4 - Humidity Sensor
- System Lead: Brian Wegner
- Choice: HIH6030
- Rationale: The HIH6030 Humidity Sensor was determined to be the best choice of the three components based on meeting all project requirements. This particular component further set itself apart from the crowd by having an extensive data sheet with example code, different schematic configurations, and having online support.
Humidity Sensor Solution - 3: HIH6030

Cost: $13.43 per unit
| Pros | Cons |
|---|---|
| Surface Mount | Expensive |
| Most Accurate | Higher Power Requirement 2.7v - 5.5v |
| Example code and setup in Data Sheet |
5 - LCD Screen
- System Lead: Brian Wegner/Xzekiel Trevino
- Choice: NHD-0216SZ-NSW-BBW-33V3
- Rationale: Due to the simplistic nature and close acquaintance with this component, we believe this can display all our information without the headache of learning other complex display layouts in the short timeframe. It also has a relatively small form factor and low cost.
LCD Solution - 3: NHD-0216SZ-NSW-BBW-33V3 :star:

Cost: $24.34 per unit
| Pros | Cons |
|---|---|
| Easy to program | Limited to 2x16 characters |
| Sample Code Available | No images |
| Can make custom fonts | Unable to order small batch (2-3 units) |
6 - Power Switch Regulator (Microcontroller)
- System Lead: Fynn Meyerhoff
- Choice: LM2575-3.3WU-TR
- Rationale: The LM2575-3.3WU-TR is a good option because it offers a reliable 3.3V suitable for most microcontrollers. This was also the same regualtor used in an in-class activity.
Power Regulator Solution - 1: LM2575-3.3WU-TR

Cost: $1.75 per unit
| Pros | Cons |
|---|---|
| Versatile with a wide input voltage range. | Lower current capacity compared to some newer designs. |
| Capable of driving a 1.0A load. | Requires several external components. |
| Available in various fixed and adjustable output versions. | Might be less efficient than newer alternatives. |
Power Budget
In developing the power budget, all major components were listed by their supply voltage and peak current draw taken from the datasheets. Below that, we categorized the components that require 3.3 or 9 volts so it was clear which components are connected to what power rail. The goal was to have the fewest amount of rails to reduce complexity of the circuit. This involved analyzing the operational profiles of each component to understand their peak and average power consumption. Based on these estimates, I was able to identify areas where power usage could be optimized, such as implementing an energy-efficient microcontroller, OLED LCD, and low powered sensors. The conclusions from this analysis suggest that we can achieve 3.7 hours of run time without compromising performance.

Introduction
Microcontrollers play an important role in electrical system projects. They serve as the ‘brain’ that controls and orchestrates the functions of various components within the system or a subsystem. These components allow designs to implement code such as Python, C+, and other advanced programing languages to control hardware and software within the device. Microcontrollers are found in nearly all modern electronic devices.
For our project, we determined that the PIC16F15354 produced by Microchip was the optimal solution for our project based on a variety of factors ranging from the number of GPIO pins to I2C/SPI computability. A further breakdown of our selection processes as well as a side-by-side comparison of alternative chip considerations can be found below.
Microcontroller Selection
Introduction
Microcontrollers play an important role in electrical system projects. They serve as the ‘brain’ that controls and orchestrates the functions of various components within the system or a subsystem. These components allow designs to implement code such as Python, C+, and other advanced programing languages to control hardware and software within the device. Microcontrollers are found in nearly all modern electronic devices.
For our project, we determined that the PIC16F15354 produced by Microchip was the optimal solution for our project based on a variety of factors ranging from the number of GPIO pins to I2C/SPI computability. A further breakdown of our selection processes as well as a side-by-side comparison of alternative chip considerations can be found below.
| Feature | Option 1 :star: | Option 2 | Option 3 |
|---|---|---|---|
| Part # | PIC16F15354 | PIC16F1517 | PIC18F47K42 |
| GPIO | 22 (21 req) | 33 | 33 |
| ADC | 24 (1 req) | 28 | 35 |
| PWM | 4 (1 req) | 0 | 4 |
| I2C/SPI | 2/0 | 1/0 | 2/0 |
| UART | 1 (1 req) | 1 | 2 |
Choice: Option 1

Reasons:
- It has 2 different I2C ports, perfect for the temperature and humidity sensor
- SPI functionality for the motor driver
- Low power consumption, ideal for a small 9V 600mAh battery
- MCC snap compatible, a familiar interface in MPLabX
-
Plenty of GPIO for LED’s and other accessories
Hardware Implementation
Introduction
In this section, we delve into the Hardware Implementation of the Portable Weather Station, outlining the intricate details of the physical components and assembly processes used in our project. We will explore the selection of sensors, circuit design, and integration techniques that enable the reliable collection and transmission of meteorological data. Additionally, this chapter provides a step-by-step guide on the assembly of the hardware components, accompanied by troubleshooting tips and considerations for enhancing device robustness and efficiency. Through detailed diagrams and practical insights, we aim to illuminate the technical foundation that supports the functionality of our weather station.
Final Schematic
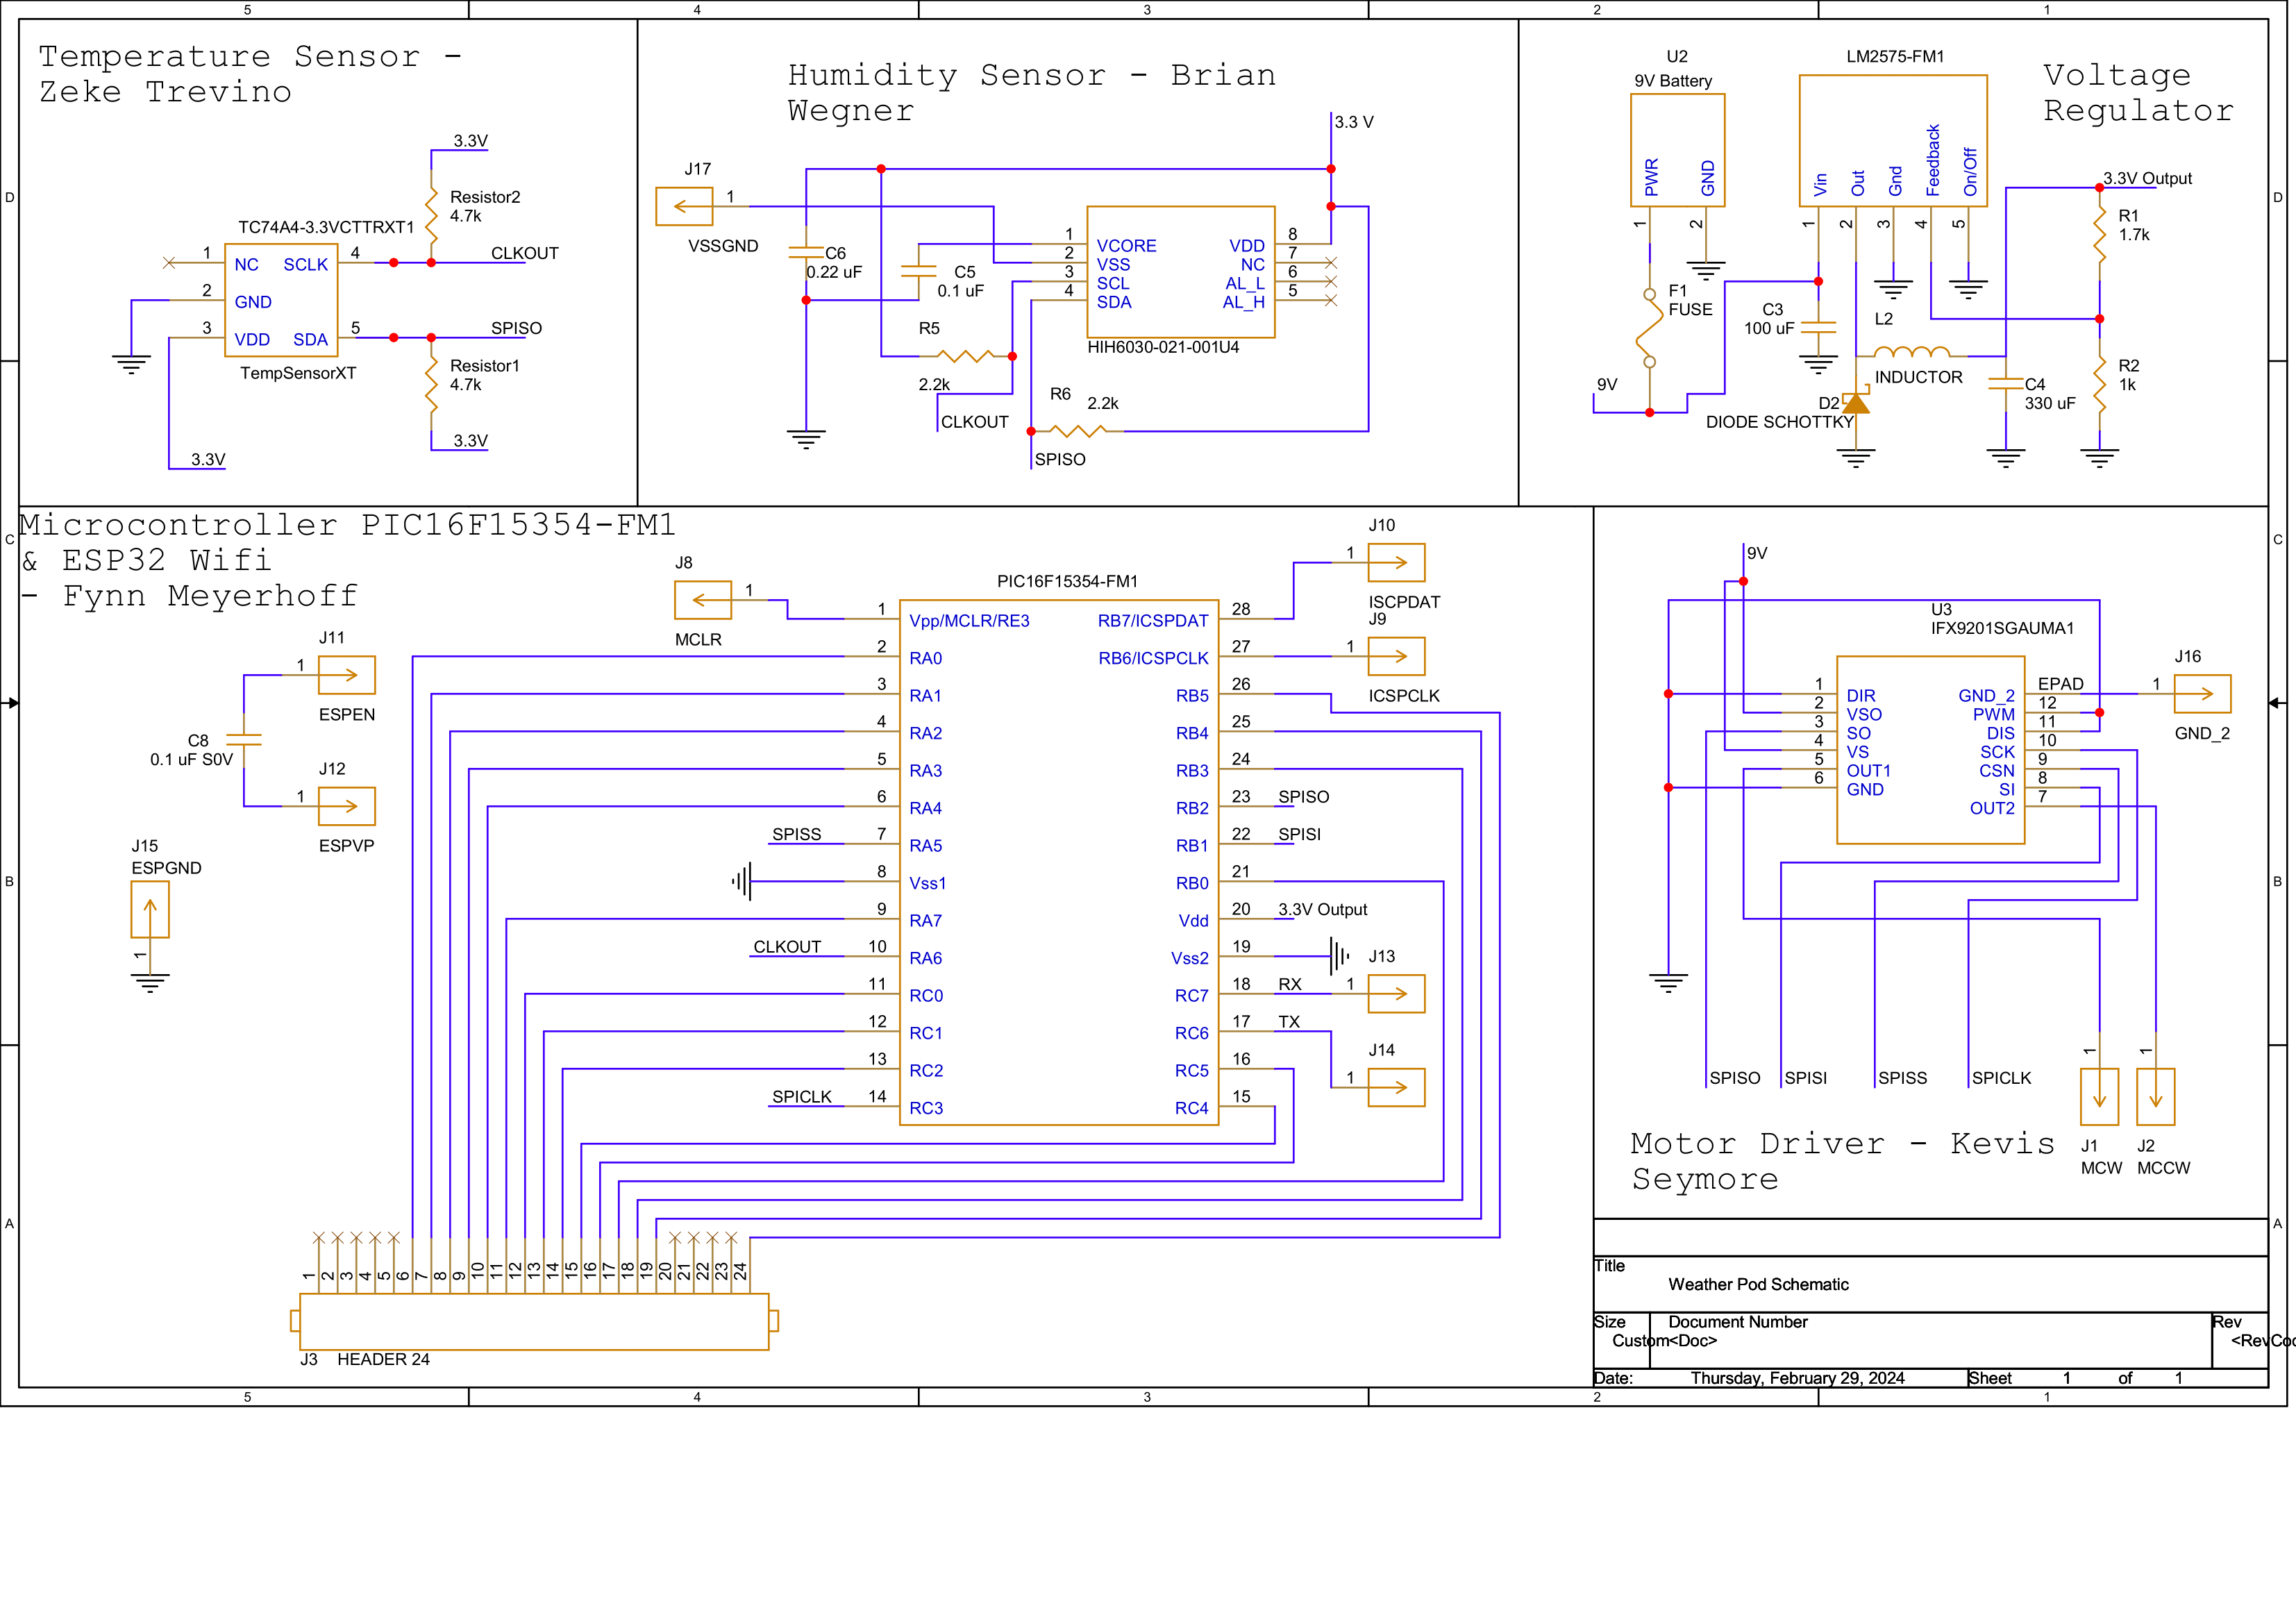
This schematic diagram represents the electrical blueprint for a Weather Pod, detailing the connections and components required for its operation. It is divided into sections, each attributed to a team member, suggesting a collaborative design effort:
Temperature Sensor
Zeke Trevino: This section outlines the connection of a temperature sensor, including a resistor for the sensor and connections for the power supply and data outputs.
Humidity Sensor
Brian Wegner: This part of the circuit features a humidity sensor with its own power connections, capacitors for stabilization, and data lines.
Microcontroller PIC16F15354-FM1 & ESP32 WiFi
Fynn Meyerhoff: The core of the system, the microcontroller, is responsible for processing the data from the sensors. It is connected to an ESP32 WiFi module, which likely enables wireless communication for data transmission.
Voltage Regulator
This section includes a voltage regulator circuit that steps down the voltage from a 9V battery to a 3.3V output, using components like capacitors, an inductor, and a diode for power management.
Motor Driver
Kevis Seymore: A motor driver circuit with an H-bridge design is included for controlling a motor’s direction and speed, possibly for moving parts of the weather station, like an anemometer or a wind vane.
Final Layout
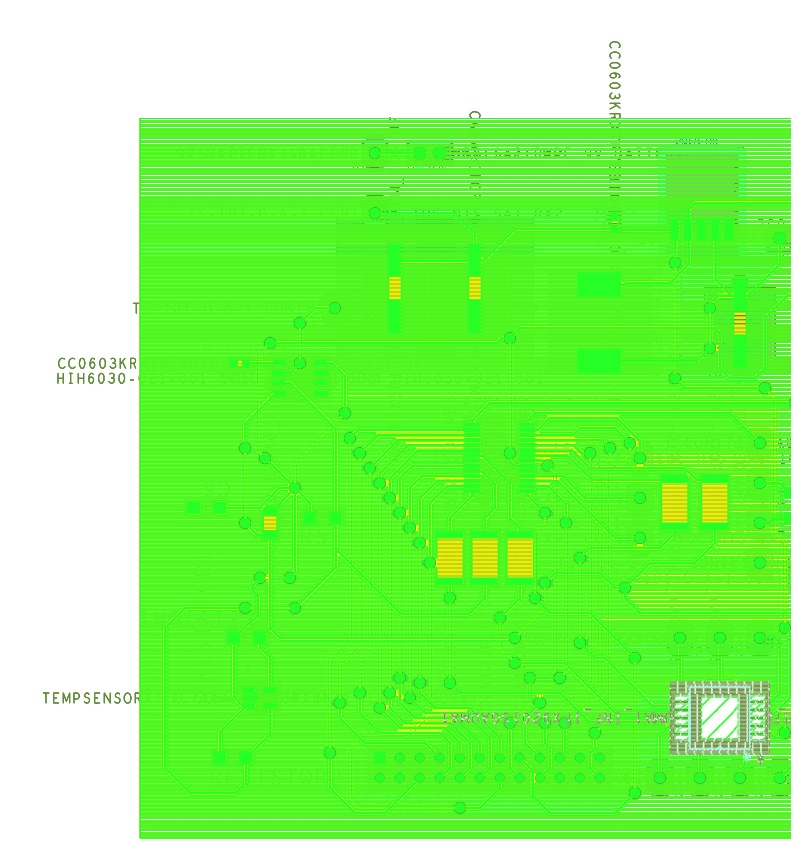
For better clarity of the top layout:
(Bottom is mainly vertical connections by vias.)
Top View
Bottom View
DRC and Submissions for Manufacturing
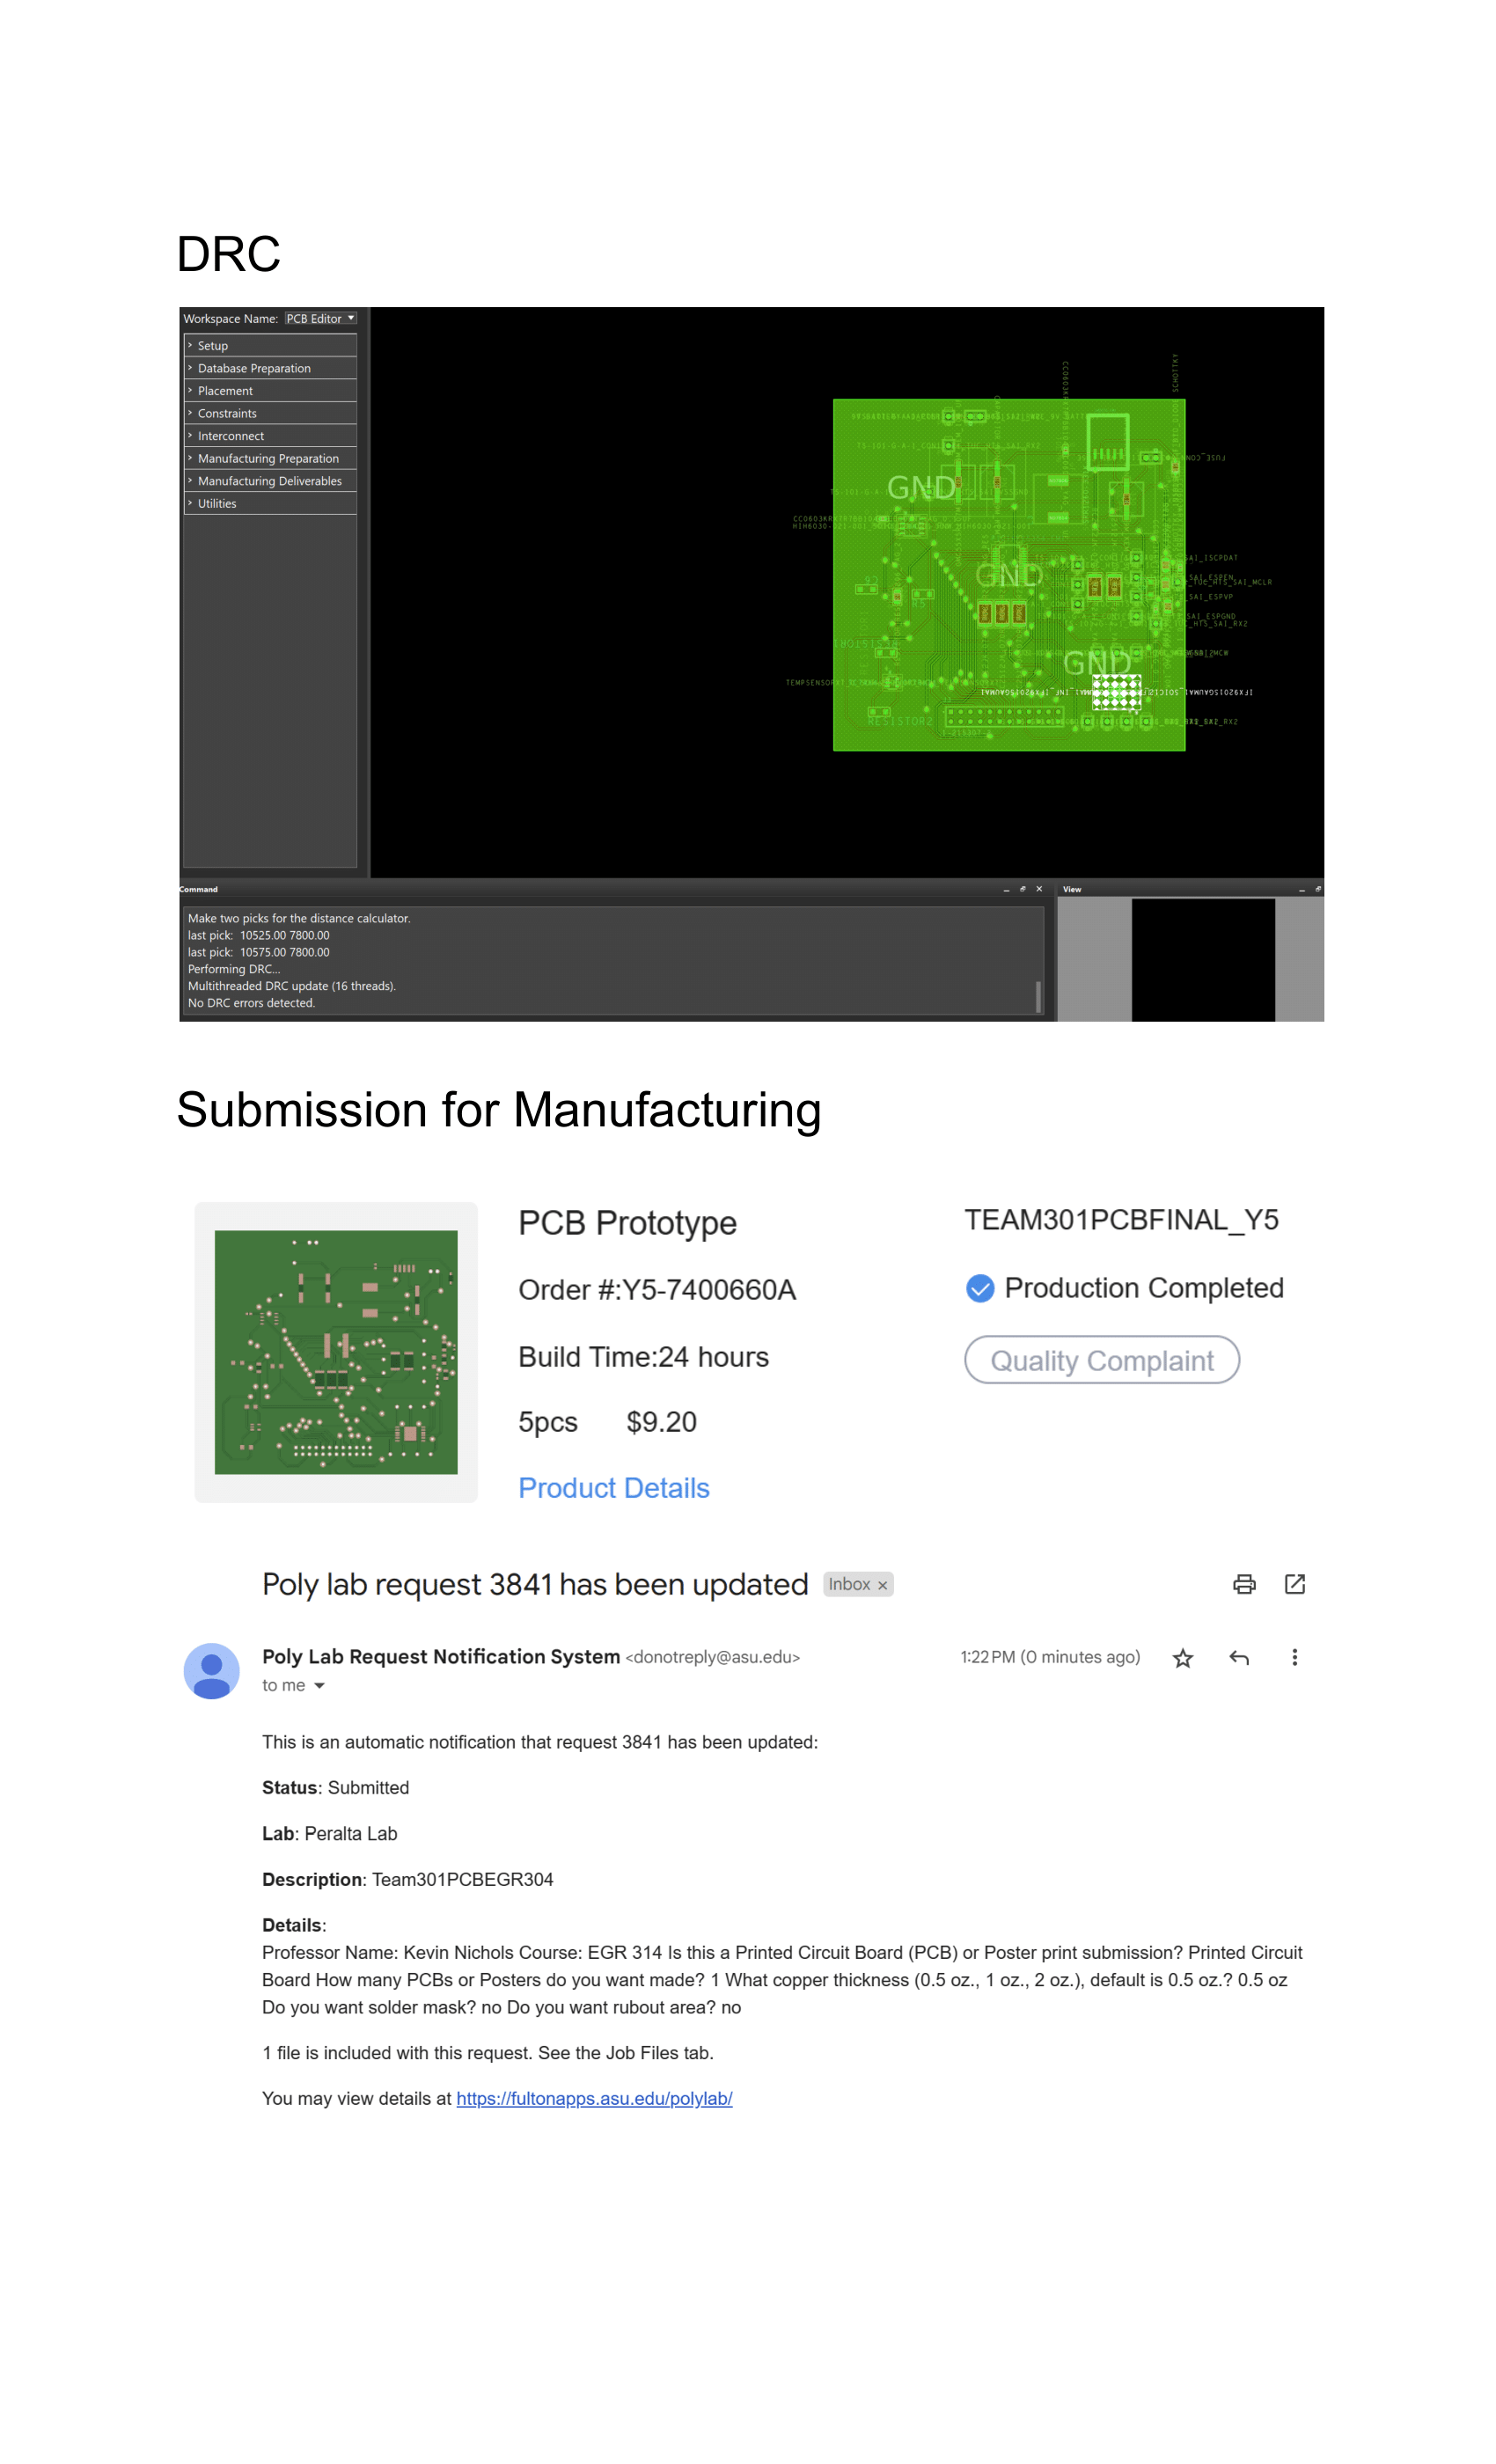 The image above shows a compilation of several snapshots related to the submission and manufacturing of a Printed Circuit Board (PCB).
At the top, there is a section labeled “DRC” which stands for Design Rule Check. This is a part of the PCB design process where the software checks the layout to ensure that it adheres to certain manufacturing and design rules. It appears that the DRC process has been completed without detecting any errors, as indicated by “No DRC errors detected.”
Below the DRC section, there is a “Submission for Manufacturing” section which shows an order for a PCB prototype labeled as “TEAM301PCBFINAL_Y5.” The order summary includes the order number, build time (24 hours), quantity (5 pieces), and the cost ($9.20). A blue check mark indicates that the production has been completed, but there is also a mention of a “Quality Complaint,” suggesting that there may have been an issue with the produced PCBs.
Finally, at the bottom, there is an email notification from the “Poly Lab Request Notification System” sent to someone with an email address at the Arizona State University domain. The email is an automatic notification that a certain request (number 3841) has been updated with the status “Submitted.” The description mentions “Team301PCBEGR304,” and the details include a conversation about the specifics of the PCB or poster submission, such as quantity, copper thickness, whether solder mask or rubber area is needed, etc. The link provided in the email likely leads to further details or the platform where the PCB manufacturing job can be tracked.
Overall, the image captures various steps in the process of ordering, manufacturing, and quality checking of a PCB for what seems to be an educational project.
Cadence Screenshots of Final Team PCB
Top View
Bottom View
Version 2.0
When analyzing the schematic for potential improvements in a “Version 2.0” of the hardware design, several areas can be considered to enhance functionality, reliability, and scalability. Here are some suggestions:
Power Supply Management
Battery Life Optimization:
While a 9V battery is currently used with a voltage regulator to power the circuit, battery life may be a limitation for long-term use. For Version 2.0, implementing a more efficient power management system with a rechargeable battery and a power-saving mode can significantly improve the device’s operational time.
Sensor Integration and Signal Conditioning
Noise Reduction on Sensor Inputs:
The temperature and humidity sensor signals could be susceptible to noise, particularly if the device is used in an industrial environment. Adding filters or shielded cabling could improve the accuracy and reliability of sensor readings.
Communication Protocols
Wi-Fi Signal Strength & Mounting ESP32 onto the PCB:
If the ESP32 module experiences weak Wi-Fi signals in its operating environment, adding an external antenna connector could improve connectivity. Mount the ESP32 onto the PCB. This would have given us a more secure and reliable connection.
Motor Driver and Control
Current Sensing:
Adding a current sensing circuit could provide feedback on the motor’s health and workload, which would be useful for predictive maintenance.
User Interface
User Interface:
Add buttons or switches for manual override or control, which could be useful if wireless communication is temporarily unavailable.
Documentation and Traceability
Clear Labeling:
Ensure all components are clearly labeled with their reference designators and values, which can be particularly important during assembly and troubleshooting.
By addressing these potential improvements, “Version 2.0” of the hardware design would likely be more robust, efficient, and user-friendly. Each change should be carefully considered in the context of the device’s intended use, the environment it operates in, and the needs of the users to ensure that the modifications align with the overall goals of the project.
Software Diagram
Key Functions and Processes
Initialization and Setup
The system begins with an initialization phase where it configures various communication protocols (I2C2, SPI1, EUSART1) and sets up initial variables. This ensures that all components are ready to function correctly, providing a stable starting point which is critical for reliable operations.
Temperature and Humidity Sensing
Temperature and humidity sensors collect environmental data. The temperature data is converted to Fahrenheit, and humidity data is translated into relative humidity (RH), which are standard units easily understandable and useful for most applications, satisfying the need for intuitive data presentation.
Data Processing and Transmission
Once collected, the sensor data is sent to the main controller (MC), where it is further processed and formatted as a string. This data is then transmitted through EUSART to the ESP32 module, allowing for remote data monitoring and analysis, catering to the need for accessibility and connectivity in modern systems.
Motor Control System
The motor’s operation is directly linked to temperature readings. If the temperature is 85°F or higher, the motor is turned on (presumably to activate cooling mechanisms), and if it’s below 85°F, the motor is turned off. This automated response system is crucial for maintaining optimal conditions automatically, reducing manual intervention and increasing system efficiency.
Indicator Lights
High temperature indicator light (HT_LED) is controlled based on temperature thresholds: set high when the temperature is 85°F or above and low otherwise. This visual feedback is vital for immediate status recognition, enhancing the user interaction with the system.
Error Handling and Feedback Loop
The system includes mechanisms to continuously check and respond to the operational parameters. This loop ensures the system behaves as expected and can handle errors or unexpected changes in environmental conditions effectively.
Fulfillment of User Needs and Product Requirements
The software diagram demonstrates a comprehensive approach to integrating various technologies to meet both user needs and technical product requirements:
Automated Environmental Control:
The system automatically adjusts its operations (e.g., turning the motor on/off) based on real-time temperature data, ensuring maintenance of desired environmental conditions.
Real-Time Monitoring and Alerts:
Through sensors and indicator lights, the system provides real-time feedback, crucial for applications requiring constant monitoring, such as in agricultural or industrial settings.
Remote Access and Control:
Data transmission capabilities to the ESP32 module allow for remote monitoring and adjustments, which is a significant advantage in enhancing system accessibility and usability, especially in distributed networks.
Reliability and Stability:
The initialization and continuous operational checks ensure the system remains stable and reliable, which is essential for critical applications where errors can have significant consequences. In conclusion, the functionality described in Team 301’s software proposal effectively addresses specific user needs such as automated environmental control, real-time data monitoring, remote system access, and reliability. By leveraging modern sensors, communication protocols, and control mechanisms, the system achieves a high level of efficiency and user-friendliness, meeting the overarching goals of the product requirements.
Revisions to Software Diagram (Previous –> Current)
- Removed toggle button interrupt
- Removed Fahrenheit to Celsius conversion
- Removed motor hatch logic
- Added Humidity and Temp sensor to the while(1) loop
- Added HT and LT LED logic
- Display updates every 2.5 seconds instead of 15
Version 2.0
For a “Version 2.0” of the software design, we can focus on enhancing modularity, maintainability, efficiency, and robustness. Here’s how we might consider updating the software flow based on the existing UML diagram:
Modular Code Design
Functional Decomposition:
Divide the code into more functions, each handling a specific task. For instance, have separate functions for sensor data acquisition, data processing, communication, motor control, and indicator management. This approach not only makes the code more readable but also easier to debug and test.
Improved Debuggability
Logging System:
Implement a logging system that captures detailed operational data and errors. This could include timestamped entries for sensor readings, system states, errors, and actions taken by the control systems.
Self-Diagnostics:
Build in self-test routines that check the status of sensors and other peripherals at startup and during operation, reporting any malfunctions.
Protocol Design Improvements
Standard Protocols:
Where possible, use standard communication protocols and libraries to ensure compatibility and reliability.
Communication Timeouts:
Implement timeouts and retries for communication protocols to handle lost connections or failed transmissions gracefully.
System Stability and Functionality
State Machine:
Implement a finite state machine for managing system states and transitions, which can simplify the control logic and make the system’s operation more predictable.
Graphical Representation of the Updated Software Flow
The updated software flow could be represented using a state diagram or flowchart. This would visually describe the system states, transitions based on events (like temperature thresholds), and the actions taken in each state.
In conclusion, improving the software design for Version 2.0 involves enhancing the modularity of the code, introducing a robust error-handling and logging system, utilizing system peripherals for increased reliability, and refining the communication protocols. These improvements would make the software more robust, stable, and maintainable, leading to a system that can meet the demands of its intended use more effectively.
Presentation Materials
Below are the presentation materials utilized during Arizona State University’s Innovation Showcase held at the Polytechnic Campus in Mesa, Arizona. Our demonstration materials provide insights into the design and fabrication processes of our final project for EGR-314.
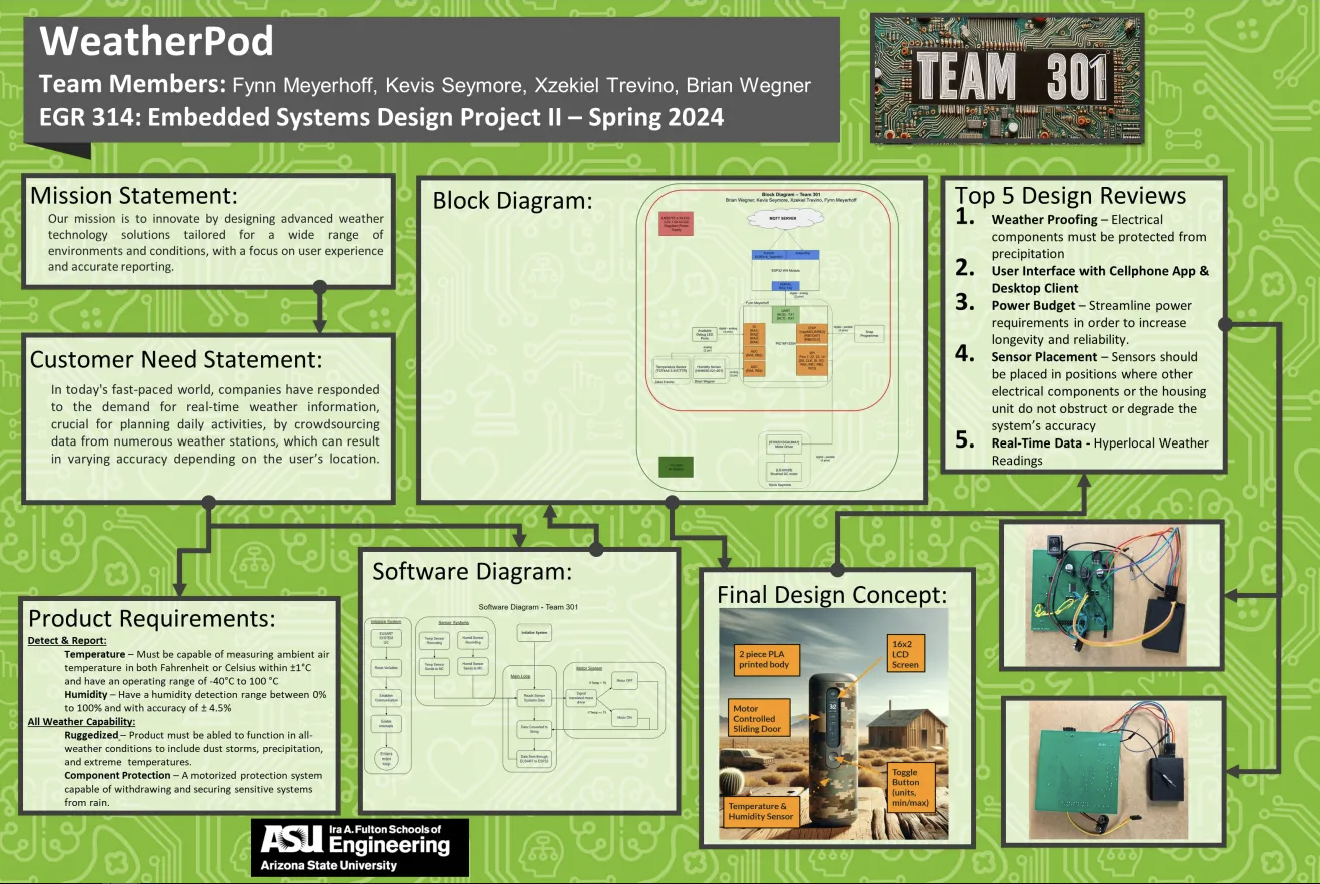
Poster
Video Demonstration

Team 301 System Verification Table
Note: Our verification table has been fully checked off and completed. Ignore the unverified connection for the humidity sensor to microcontroller
Lessons Learned
- When selecting a microcontroller, make sure you have a solid understanding of all the pins’ capabilities in I2C and SPI.
- Prioritize using components the person in charge of them has had experience using before or has similarities to components they have experience with.
- Due to individual device addresses, multiple I2C devices can effectively communicate along the same input and output pins.
- Having as many device inputs and outputs print to Putty can dramatically increase the effectiveness of the debugging stage of development.
- Ensure dimensions of parts are checked thoroughly before being ordered as parts being too small may be an issue when soldering.
- The layout of a PCB can be kept cleaner by designating layers as the primary horizontal or vertical movement layers and using via to transition between them.
- When noise is not a significant issue, you can minimize trace length by centralizing power buses to be used by various components.
- Separate components in PCB layout enough to make soldering simple, while meeting total PCB size restrictions.
- Group subsystem components in the PCB layout for better clarity and eases of recognition when soldering and testing subsystem connectivity.
- If noise is a potential issue for a problem that arises, try jumping to a breadboard and adding different size capacitors to pull some of it to ground. If that works, implement the changes for a cleaner signal.
Recommendations for Future Students
The most important and often overlooked steps to any learning or training regiment is performing an after-action review to capture the best practices in order to repeat success and to identify failures in order to determine their root causes so they can be avoided or mitigated in future projects. This important step aims to lessen the burden of difficulty for those following in our footsteps.
After a team deliberation, it was determined that these recommendations could help the planning and fabrication process of future EGR-314 students as they learn from our best practices, mistakes, and hardships.
Recommendations for Future Students:
1. Microcontroller Selection: Ensure understanding and capabilities of all I2C and SPI pins to prevent overlapping component pin requirements.
2. Component Selection: Familiarization of components helps improve learning hurdles. While it is not required for the system designer to know their component inside and out at the time of selection, having someone on the team who is familiar with that component will help reduce the learning curve. This person can serve as a mentor to help the designer overcome any difficulties during the design and fabrication process.
3. Debugging Lesson Learned: By having as many component devices as possible print to the Putty software suite, it allows for better troubleshooting by allowing designers to contrast and compare how different systems are interacting with one another.
4. Outside Resources: Our team found that investing in a heat gun, flux and solder, and other components out of pocket enabled us to work on the project outside the classroom. This provided us with the freedom to operate when and where we desired without the limitations of office hours or equipment shortages/availability. We understand that this is a financial cost and can’t be achievable by all teams, however there is value in this recommendation if affordable.
5. Evaluate Component Sizes: Double check the size of the components and determine if they are within the skill set of the user to solder onto a PCB. Some of our initial components ordered were so small that it was impossible to solder by hand without damaging the component.
6. Troubleshooting: Our team determined it was a best practice to install header pins throughout our PCB. This allowed for additional flexibility should different components be needed to swap out, correct wiring issues, and provide an additional ability to troubleshoot the system.
Appendix
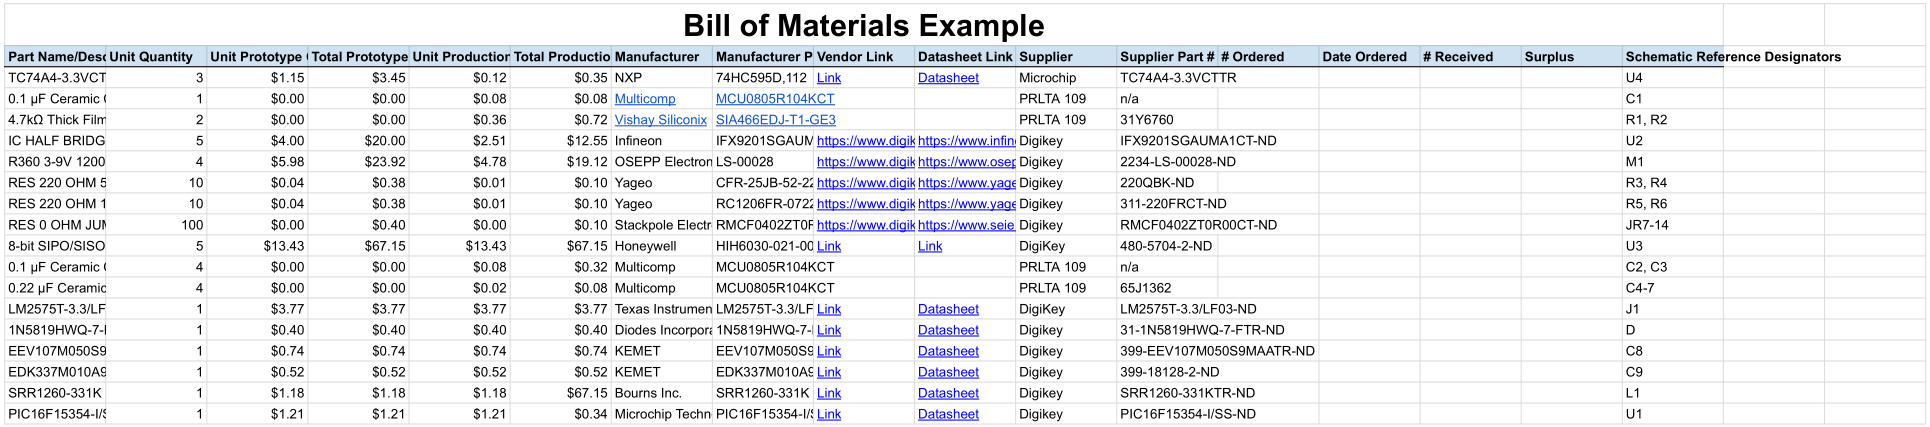
1. Bill of Materials
2. Team Code
ESP32 & MPLabX code
3. MQTT Topic Table
4. MCC Configuration
5. Additional Team Organization Content
Communication Channels
Team Communication Table
| Name | 1st Choice | 2nd Choice | 3rd Choice |
|---|---|---|---|
| Brian | Discord | Text | |
| Zeke | Discord | Text | Slack |
| Kevis | Discord | Text | |
| Fynn | Text | Discord | Zoom |
Team 301 will be using a PACE (Primary, Alternative, Contingency, Emergency) plan as the model for determining team communications. The team’s preferred methods of communication match most closely with the PACE plan. Team members will establish communications using the primary method first, then working through subsequent alternatives until communication is established.
PACE Plan
-
Discord (Primary): - Main channel for regular team communications.
-
Short Message Service (SMS) / Text (Alternative): - For quick updates and when Discord is not available.
-
E-mail (Contingency): - For more formal or detailed communication needs.
-
Face-to-Face during Class (Emergency): - For urgent matters requiring immediate, in-person discussion.
5A. Communication Procedures
As per the PACE plan, team members will prioritize methods of communication using this plan. The team will first attempt to communicate through Discord, and if that’s not possible, we will move to Text, and so on. This approach ensures all team members stay on track and are aware of which communication methods to use as a fallback if the first option is not available.
Managing Instructor Correspondence
- Collaborative Approach:
- The team adopts a collaborative strategy to ensure effective communication and timely resolution of queries.
- Designated Point of Contact:
- Peralta 103 is designated as the individual responsible for handling instructor correspondence, acting as a liaison between the team and the instructors.
- Maximizing Office Hours:
- The team commits to utilizing instructor office hours as much as possible to stay updated on assignments and project deadlines.
5B. Meeting Schedule and Availability
People:
- 🟥 B = Brian
- 🟩 X = Xzekiel
- 🟦 K = Kevis
- 🟨 F = Fynn
Communication methods: SMS (text), Discord, Email, in-person
| Time | Sun | Mon | Tue | Wed | Thu | Fri | Sat |
|---|---|---|---|---|---|---|---|
| 8:00 | 🟨/🟥 | 🟨/🟥/🟩 | 🟥/🟩 | 🟥/🟩 | 🟨/🟥 | ||
| 9:00 | 🟨/🟥 | 🟥 | 🟥 | 🟥 | 🟨/🟥 | ||
| 10:00 | 🟥/🟦 | 🟥/🟦 | 🟥/🟦 | 🟥/🟦 | 🟥 | ||
| 11:00 | 🟥/🟦 | 🟥/🟦 | 🟥/🟩 | 🟥/🟦 | 🟥/🟩 | 🟥 | |
| 12:00 | 🟦 | 🟦 | 🟦 | 🟦 | |||
| 13:00 | 🟦 | 🟦 | 🟦 | 🟨/🟩/🟦 | 🟨/🟦 | ||
| 14:00 | 🟦 | 🟨/🟩/🟦 | 🟨/🟦 | ||||
| 15:00 | 🟨/🟦 | 🟨/🟩/🟦 | 🟨/🟩/🟦 | 🟨/🟩/🟦 | |||
| 16:00 | 🟨/🟦 | 🟩/🟦 | 🟩/🟦 | 🟨/🟩/🟦 | 🟨/🟩/🟦 | ||
| 17:00 | 🟨/🟦 | 🟨/🟩 | 🟦 | 🟩 | 🟩/🟦 | 🟨/🟩/🟦 | 🟨/🟩/🟦 |
| 18:00 | 🟨/🟩 | 🟦 | 🟩 | 🟩/🟦 | 🟨/🟦 | 🟨/🟩/🟦 | |
| 19:00 | 🟨/🟩 | 🟩 | 🟨/🟩 | ||||
| 20:00 | 🟨 | 🟨 |
5C. Roles & Responsibilities
| Role | Duties |
|---|---|
| Meeting Leader - Brian Wegner | Schedules team meetings, creates and distributes an agenda for each meeting, and runs each meeting. |
| Meeting Recorder - Xzekiel Trevino | Takes minutes of each team meeting, including attendance, and records action items and to whom they are assigned. |
| Assignment Leader - Fynn Meyerhoff | Coordinates the team’s work on a given assignment to Canvas before the due date. |
| Project Monitor - Kevis Seymore | Tracks the team’s progress relative to the project schedule (Gantt chart) and keeps team members apprised of deadlines and project status. |
5D. Team Coordination & Accountability
- Pre-Assignment Coordination:
- 24-Hour Rule: At least 24 hours before an assignment’s due date, responsibilities for specific sections are assigned.
- Notification via Text: Once a section is completed, the responsible member notifies the group via text.
- Collective Review: The entire team reviews the work against the rubric before submission, ensuring completeness.
- Role Selection & Support:
- Choose Your Strengths: Team members select tasks they are comfortable with before each assignment.
- Collaboration & Support: If a team member struggles with a topic, collaboration is encouraged, leveraging external resources like online research, assistance from other teams, or reaching out to the professor or a TA.
- Individual Responsibility:
- Accountability for Assigned Sections: Each member is responsible for their own work.
- Openness to Feedback: Welcoming feedback is essential for individual and team growth.
5E. Conflict Recognition & Resolution
Big Picture Strategy:
- Recognizing Conflict:
- Goal: Aid in team development by transitioning through stages efficiently, aiming to spend most time in the performing stage.
-
Tuckman’s Five Stages of Team Development:
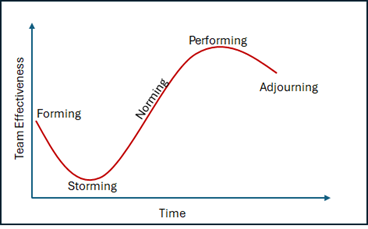
Stages of Team Development:
-
Forming: Getting to know each other, understanding the team’s purpose, structure, and leadership.
-
Storming: Conflict arises as roles and opinions emerge. It’s crucial for growth, but shouldn’t be prolonged.
-
Norming: Recognizing and resolving differences, establishing norms and roles. Unity begins to form.
-
Performing: The team works smoothly, focusing on team goals with independent action.
-
Adjourning: The final stage of dissolution, aiming for closure and maintaining future cooperation potential.
Detail-Oriented Strategy:
-
Conflict Intervention: Strategies vary depending on the situation and individuals involved.
-
Counseling as a Tool: Improve the team member’s contribution, not to admonish.
Conflict Resolution and Counseling Guide:
- Identify the Problem:
- Clearly state the issue at hand.
- Identify Solutions:
- Suggest practical solutions.
- Counseling Techniques:
- Active Listening, Empathy, Confidentiality, Goal Setting, Providing Resources.
-
Resolution Approaches:
- ** Peer-to-Peer:**
- First-level, professional one-on-one communication.
- ** Team-to-Peer:**
- A team approach is used, avoiding alienation.
- ** Instructor-to-Team:**
- Escalation for unresolved issues, involving the professor.
- ** Instructor-to-Peer:**
- Final step for unresolved conflicts requiring outside intervention.
- ** Peer-to-Peer:**
6. Acronyms & Key Terms
A - Ampere
AC – Alternating Current
ADC - Analog-to-Digital Converter
AQI – Air Quality Index
AW – All-Weather
AZ - Arizona
C - Celsius
CCW - Counter Clockwise
CW - Clockwise
DC – Direct Current
EGR – Engineering
EMS – Emergency Management Services
ESP32 - Espressif32
EUSART - Enhanced Universal Asynchronous Receiver Transceiver
DC - Direct Current
DiY - Do it Yourself
DRC - Design Rule Checking
F – Fahrenheit
GHz – Giga Hertz
GND - Ground
GPIO - General Purpose Input/Output
ICSP - In-Circuit Serial Programming
IR - Infrared
LCD – Liquid Crystal Display
LED - Light-Emitting Diode
MCC - MPLAB® Code Configurator
MHz – Mega Hertz
MPH – Miles Per Hour
MQTT – Message Queuing Telemetry Transport
PACE - Primary, Alternative, Contingency, Emergency
PCB - Printed Circuit Board
PLA – Polylactic Acid
PWM - pulse width modulation
RF – Radio Frequency
RS – Register Select
RX – Receive
SMART - Specific, Measurable, Achievable, Relevant, Time-bound
SMS - Short Message Service
SPI - Serial Peripheral Interface
TA - Teaching Assistance
TX – Transmit
UART - Universal Asynchronous Receiver / Transmitter
UV – Ultraviolet
V - Volts
Vdd - drain to drain voltage
Vss - Voltage Source Source
WiFi - Wireless Fidelity
WS – Weather Station
WX – Weather